



 82 / 98

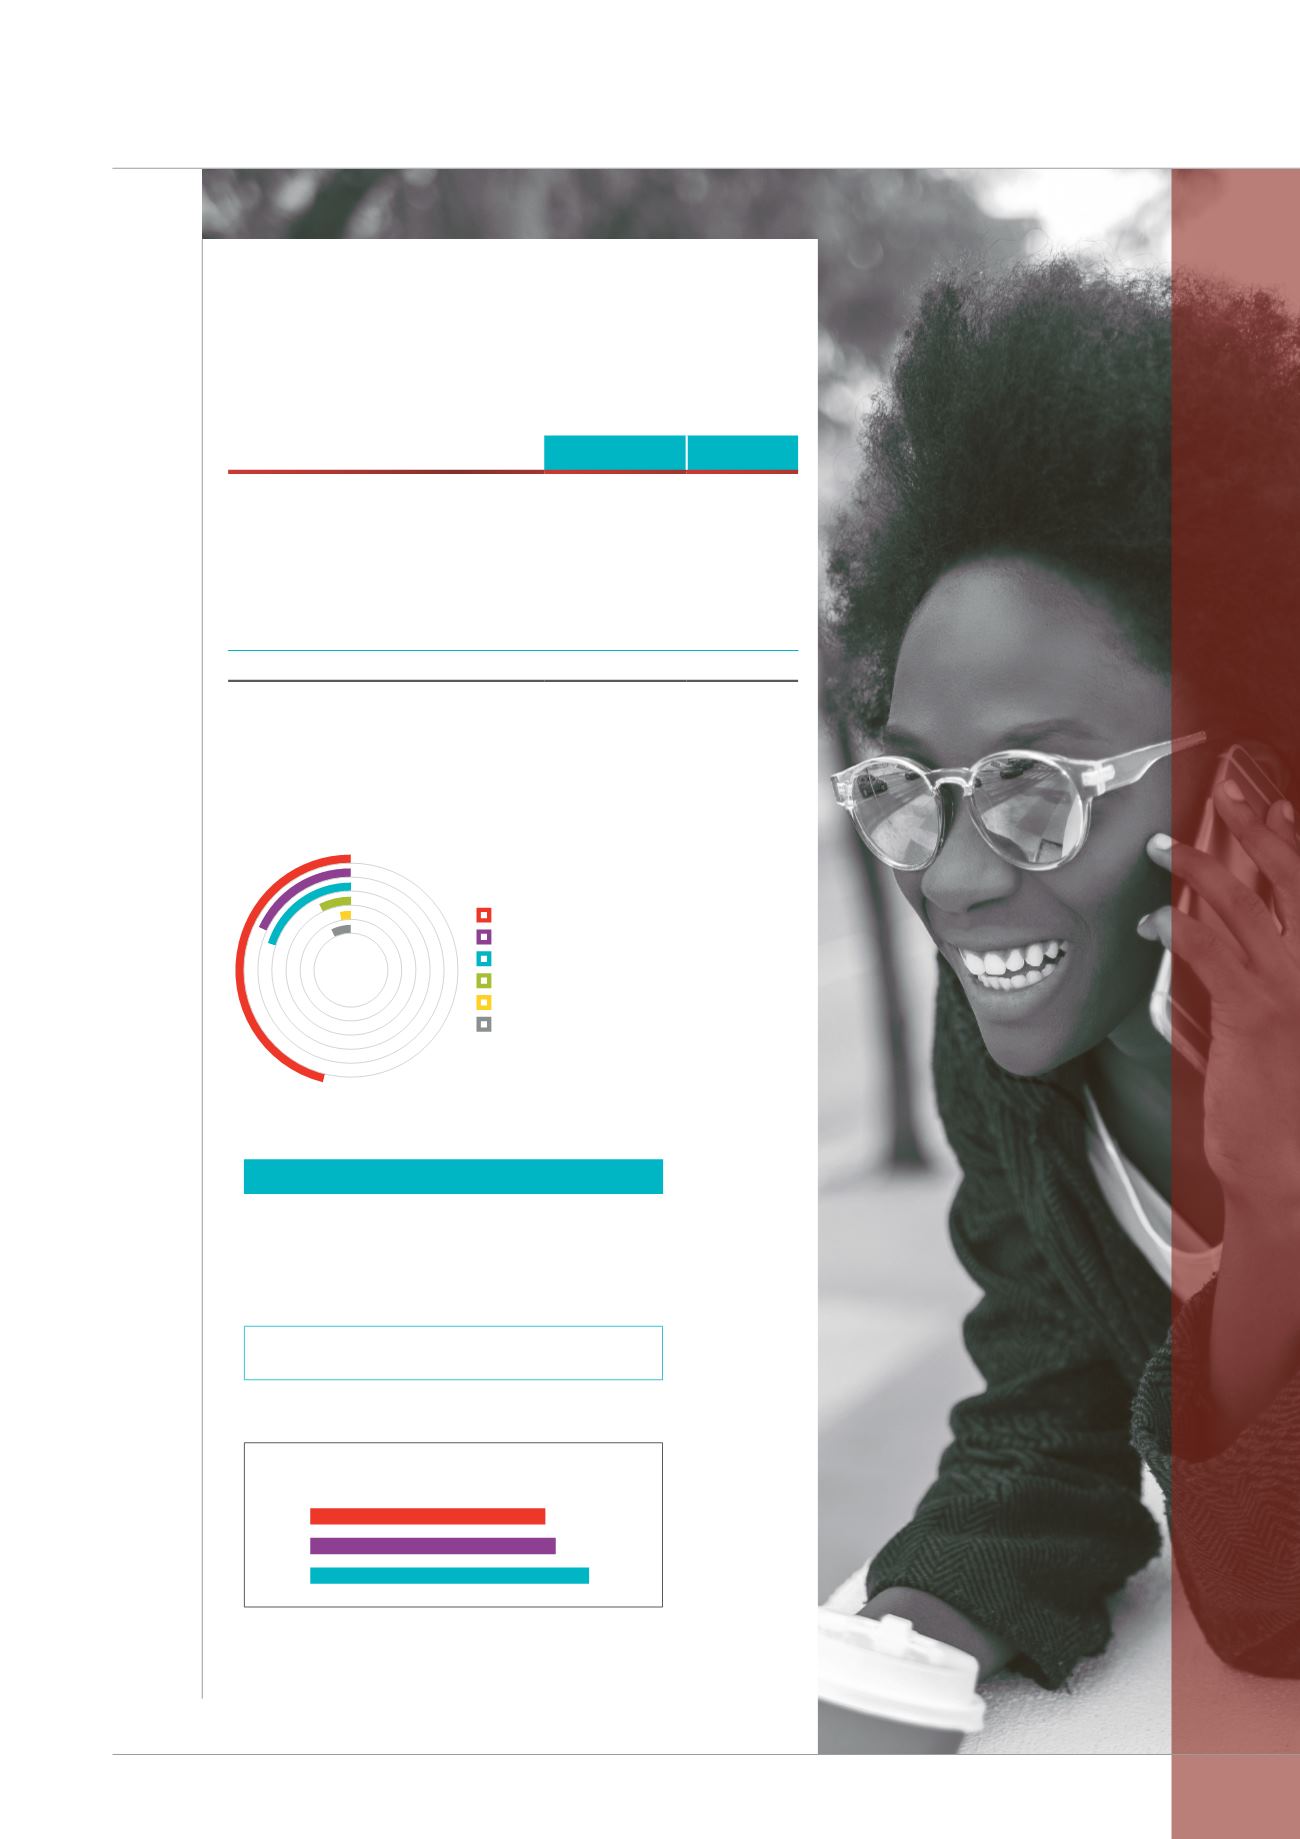
Institutional shareholding
(%)
■
PIC
46%
■
South Africa (excl. PIC)
18%
■
United States
20%
■
United Kingdom
7%
■
Rest of Europe
3%
■
Rest of world
7%
2017
■
PIC
46%
■
South Africa (excl. PIC)
18%
■
United States
20%
■
United Kingdom
7%
■
Rest of Europe
3%
■
Rest of world
7%
Total dividend declared
(R million)
2016
2017
2018
11 829
12 350
14 030
+13.5%
R153.07
Vodacom share price closed at
on 31 March 2018 with a high of R186.99
and a low of R134.96, during the year.
Share information
Total shareholding
March 2018
# of shares % holding
Vodafone Investments SA (Pty) Limited
1 110 629 881
64.5%
Government Employees Pension Fund
200 978 440
11.7%
Wheatfield Investments 276 (Pty)
Limited
15 421 231
0.9%
Institutional investors
306 337 015
17.8%
Retail positions
24 139 795
1.4%
Other
1
63 907 419
3.7%
1 721 413 781 100.0%
1. Balance of remaining holdings, including shares below analysis threshold.
May include additional institutional/retail shareholdings.
78
Vodacom Group Limited
Integrated report for the year ended 31 March 2018